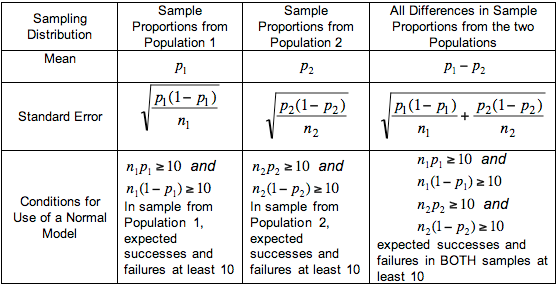
The Effect of P on Standard Error
Standard Error
Standard error is approximate standard deviation of a statistical sample population in statistics. The accuracy is measured of the sample that is selected from the population by calculating standard deviation. When a actual mean derives a sample mean of the entire population, the deviation obtained is the standard error of sample.
Sample Proportion , sampling is done in order to calculate the proportion of a population that has particular features. It varies from particular sample to another sample in a manner that cannot be predicted by certainty. As it is a Random Variable it is denoted by p-hat, mean µ p-hat and standard deviation σ p-hat.
The sample proportion of a sample of a population is directly proportion to standard error. That mean as sample proportion will increase standard error will also increase and if sample proportion decreases standard error also decreases.
Formula’s for standard error,

Sampling Distribution for Sample Proportion
Let p = population proportion of interest or binomial probability of success. Let p-hat= sample proportion or proportion of successes. If numerous random samples or repetitions of the same size n are taken, the distribution of possible values of p-hat is approximately a normal curve distribution with
- Mean = p
- Standard deviation = s.d.(p-hat )=

- This approximate distribution is sampling distribution of p-hat
Example
Suppose the proportion of all School students who have used Edureka in the past 6 months is p = 0.40. For a class of size N = 200, representative of all School students on use of Edureka, what is the chance that the proportion of students who have used Edureka in the past 6 months is less than .32 (or 32%)? NOTE: This would imply that 32% of the sample students said “yes” to having used Edureka, or 64 of the 200 said “yes”. This means the sample proportion p-hat is 64/200 or 32%
Solution. The mean of the sample proportion p-hat is p and the standard error of p-hat is S.E.(p-hat)=√p(1−p)n
S.E.(p-hat)=p(1−p)n. For this Edureka example, we are given that p = 0.40. determine
S.E.(p-hat)=√p(1−p)n=√0.4(1−0.4)200=0.0346 Standard Error
(p-hat)=p(1−p)n=0.4(1−0.4)200=0.0346.
So, the sample proportion p-hat is about normal with mean p = 0.40 and SE(p-hat) = 0.0346.
The z-score for 0.32 is z = (0.32 — .40) / 0.0346 = -2.31. Then using Standard Normal Table
Prob( p-hat< .32) = Prob(Z <-2.31) = 0.0104.
